What is the hot spot debate about?
Already for over a decade, all climate models have been predicting a significantly (100%) higher warming in the higher part of the troposphere than at the surface in the tropics. This is called “the tropical hot spot”.
All this time, balloon nor satellite measurements managed to find this hot spot, so it is now by sceptical scientists normally referred to as “the missing tropical hot spot”.
It is by many presented as the most convincing proof of the unreliability of the climate models.

Tropical hot spot: model outcome vs observations
Mainstrean scientists have not shown much interest in the case. They claim that the hot spot is a simple physical phenomenon, and has nothing to do with greenhouse gasses. Any warming at the surface will double at tropopause altitude. So obviously the measurements must be wrong.
Hot Spot Physics
The reason that this doubling is expected can be found in the saturated adiabatic lapse rate (SALR). For your convenience I use the same graph as in the Hadley cell analysis as blotting pad. I explained there why rising and descending parcels of air behave according to these curves.
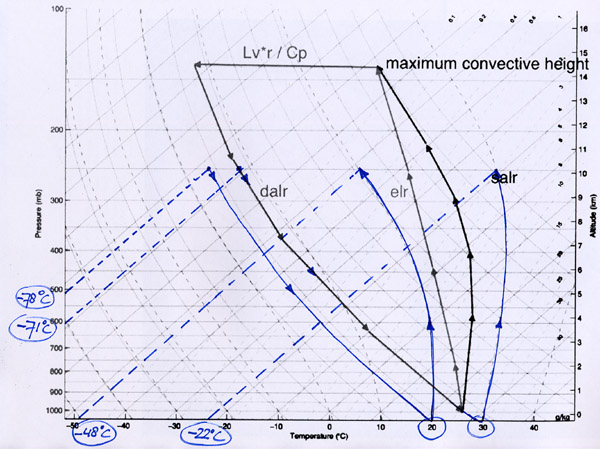
Hot spot SALR and DALR
To check the hot spot explanation you can follow a parcel of air of 20C starting at the surface and moving up along the SALR line to 10km height. Temperature will have dropped with 68 degrees to –48C.
Then follow a parcel of air of 30C at the surface to 10 km height, and you see that it has cooled down with 52 degrees to -22 C.
Clearly a 10 degrees warming at the surface has more than doubled to 26 degrees at 10 km altitude.
Some may argue that not all air in the tropics is rising according to the SALR. There is also descending air, even as part of tropical storms, which is rising in temperature, so it cannot be saturated. To address this issue, I added the dry adiabatic lapse rate (DALR) behaviour in the diagram.
Following the DALR there is no increase in warming, compared to the surface: the 10 degrees warming at the surface from 20C to 30C results in a warming in the higher troposphere of only 7 degrees.
As you see, the DALR requires a 30 to 50 degrees cooling before the air that reached 10km altitude can descend again. As I explained in the last chapter, this takes a very long time at that altitude, so only a small part of the rising air can descend locally, which explains the existence of the Hadley cells.
Some of the descending air will cool down by contact with precipitation, or will absorb vapour from evaporating water drops, thus cooling down faster, and follow an adiabatic lapse rate that is somewhere in between the SALR and the DALR.
Considering the strong dominance of the SALR in the tropics, it appears safe to say that in the tropics in a rising parcel of air, a warming of the surface will translate into a doubling of the warming higher in the troposphere, resulting in the hot spot.
So, are the measurements wrong indeed?
Modelling and reality
I would like to remind you of chapter 9 where I claimed that the most common explanation of the greenhouse effect was based on a far too simplified representation of the atmosphere. Worldwide convection and latent heat transport do not behave as a parcel of air rising to the tropopause and radiating out its energy to space right there.
In chapter 10 I explained how this mechanism is working in reality in the Hadley Cell, and I showed that the energy is mainly radiated into space more than a thousand miles from the place where it was transported upwards by convection, and mainly from only 1,5 to 5km height, in the subtropics.
Apparently, simplified basic physical laws sometimes do not translate into reality that easily in complex climate issues.
Hot spot physics and reality
Quite similar to the simplified description of the greenhouse effect, the simple ALR based explanation for the hot spot may fail to describe reality.
The atmosphere in the tropics cannot be modelled as a theoretical parcel of moist air rising straight to the tropopause. As discussed before, tropical convection is dominated by the tropical thunderstorms, which are extremely violent phenomena, that move enormous amounts of energy to the tropopause.
Inside a storm, there are ascending air volumes that behave according to the SALR, but at the same time there is very cold descending precipitation that cools the environmental air, as well as the surface, and winds blowing in all directions, also vertically.
So, the averaged vertical temperature curve of thunderstorms and their environment is not necessarily linked to the yearly averaged surface temperature.
Tropical thunderstorm
Storm behaviour, a theory
This claim can be supported by the essence of a thunderstorm: it originates from the temperature difference between the warming surface and the air of the lower troposphere. So it will develop as soon as this temperature difference has reached a certain value. On a hot day that will be earlier than on a cold day, but at the same surface temperature. And it will immediately cool the surface beneath the storm center considerably.
This mechanism has been observed by satellite images. For more information about the mechanisms that work in a tropical storm, see the highly recommended presentation of Willis Eschenbach on ICCC4.
This mechanism would result in vertical temperature profiles of storms that will tend to be the same on both warm and cold days. On a hot day they just start earlier and last longer, transporting a lot more energy to the tropopause, without the necessity of a temperature change at any height. An increase of the volume of air and water vapour that is transported upwards would suffice to transport and store the extra energy, without producing a hot spot.
A more powerful, longer lasting storm may penetrate deeper through the tropopause and cool down to a lower temperature at the top than a weaker, lower storm. It may produce more and colder precipitation, thus cooling down the mid troposphere more than a weaker storm. Considering this, a tropical cold spot might be more likely than a hot spot! It is remarkable that exactly where the tropical thunderstorms are most frequent (slightly north of the equator), in the HadAT2 satellite data (see first illustration) a cold spot is observed.
This colder air, containing more energy, because of it’s greater volume, will for a large part move to the subtropics, and descend there, radiating most of its energy to space while descending.
In this model, some warming in the downward part of the Hadley cell in the subtropics can be expected. This will radiate the extra amount of energy out to space.
This warming can be found in the HadAT2 data above.
Note: the HadAT2 data are in C/decade while the model forcing data are over a 40 years period. The warming in the subtropics (orange, 0,2 C per decade) in de HadAT2 data is comparable with the dark brown (0,8 C in 40 years) in the model data.
So the extra energy that is transported upwards in the tropics on a hot day, or in a warmer climate, by an increased volume of air, will be radiated to space in the subtropics, without being visible as an increase of temperature in the mid troposphere in the tropics.
Does this explain why the hot spot is missing?
It just might. The explanation above sounds logical and realistic to me, but I may be wrong on some points.
If I am right, the models are missing an essential mechanism of our climate, that forms a powerful negative feed back, or even a thermostat, when Eschenbach is right.
I just want to show that it is too easy to simplify reality into a basic model, and then claim that climate should behave according to your model. As soon as observations conflict with the outcome of your model, you should seriously reconsider it, or come up with a satisfactory explanation.
At least, that is how the world works for engineers like me.
Does the missing hot spot prove that the AGW hypothesis is wrong?
No, it does not. The assumption of a hot spot is not linked to greenhouse gasses.
But if it is produced by all climate models, and it is missing in all observations, obviously the parametrisation of the physics of the Hadley cell in the models is flawed, which would prove the inability of climate models to represent the way tropical climate works.
That would not just be a minor flaw in the models: the Hadley cells are by far the largest energy transporters of our atmosphere, and they dominate the earths climate. If you cannot get them right, you cannot claim to have modelled climate accurately, and none of the outcome of your model can be considered to be meaningful.
So, as far as the AGW hypothesis is based on climate models (and I would not know another base for it), the missing of the tropical hot spot indirectly but seriously affects its credibility.
Some minor changes have been made to this chapter.
The hot spot wasn’t missing, even back when you made this post. The hot spot has been shown in paper after paper. Here are just some of the papers showing the hot spot:
In satellite data:
#1 : “Contribution of stratospheric cooling to satellite-inferred tropospheric temperature trends”
#2 : “Temperature trends at the surface and in the troposphere”
#3 : “Removing diurnal cycle contamination in satellite-derived tropospheric temperatures: understanding tropical tropospheric trend discrepancies”, table 4
#4 : “Comparing tropospheric warming in climate models and satellite data”, figure 9B
In radiosonde data:
#5 : “Internal variability in simulated and observed tropical tropospheric temperature trends”, figures 2c and 4c
#6 : “Atmospheric changes through 2012 as shown by iteratively homogenized radiosonde temperature and wind data (IUKv2)”, figure 1 and 2
#7 : “New estimates of tropical mean temperature trend profiles from zonal mean historical radiosonde and pilot balloon wind shear observations”, figure 9
In re-analyses:
#8 : “Detection and analysis of an amplified warming of the Sahara Desert”, figure 7
#9 : “Westward shift of western North Pacific tropical cyclogenesis”, figure 4b
#10 : “Estimating low-frequency variability and trends in atmospheric temperature using ERA-Interim”, page 351
A couple of other points:
1) The RSS tropospheric warming values in paper #3 are spuriously low. This was corrected by the RSS team in:
#11 : “Sensitivity of Satellite-Derived Tropospheric Temperature Trends to the Diurnal Cycle Adjustment”
The corrected RSS trend is shown in figure 4B of paper #4.
2) The ERA-I underestimates lower troposphere warming, as acknowledge in paper #10 and:
#12 : “A reassessment of temperature variations and trends from global reanalyses and monthly surface climatological datasets”
3) The NCEP-2 re-analysis has a history of under-estimating tropospheric warming, as discussed in:
#13 : “Response to Comment on “Contributions of Anthropogenic and Natural Forcing to Recent Tropopause Height Changes””
Dear mr Atomsk Sanakan,
I prefer not to allow anonymous reactions.
If for some reason your anonymity is required, you can ask me to allow it on the email address given under “contact”.
If I do not receive such an email, I may remove your reaction.
Regards,
Theo
Dear Mr Sanakan,
The tropical hot spot discussion is not an easy one.
But in a very constructive dialogue between leading sceptic and mainstream scientists (Sherwood, Mears and Christy) there was agreement that the observations and the model predictions were significantly different.
Short summary:
http://www.climatedialogue.org/wp-content/uploads/2014/10/Climatedialogue.org-summary-the-missing-tropical-hot-spot.pdf
Extended summary:
http://www.climatedialogue.org/wp-content/uploads/2014/10/Climatedialogue.org-extended-summary-the-missing-tropical-hot-spot.pdf
Tropical Hot Spot Dialogue
https://www.climatedialogue.org/the-missing-tropical-hot-spot/
A better jury to decide on this topic will be hard to find!
So there is in fact some form of missing tropical hot spot, as I describe.
With kind regards,
Theo
Hello,
I see no e-mail listed under your “Contact” tab. So I am unable to meet your request. If you can provide me with an e-mail address, then I can meet your request.
Anyway, I’m familiar with that “constructive dialogue” and it’s out-dated. After that dialogue happened, both Sherwood and Mears have co-authored studies showing the hot spot in Sherwood’s IUKv2 analysis and in Mears’ RSSv4.0 analysis. I already cited those studies:
#4 : Mears’ “Comparing tropospheric warming in climate models and satellite data”, figure 9B
#6 : Sherwoord, “Atmospheric changes through 2012 as shown by iteratively homogenized radiosonde temperature and wind data (IUKv2)”, figure 1 and 2
Other studies were also published since the “constructive dialogue”; these studies incorporated IUK and RSS data, and these studies also show the hot spot. I already cited some of those studies for you:
#3 : “Removing diurnal cycle contamination in satellite-derived tropospheric temperatures: understanding tropical tropospheric trend discrepancies”, table 4
#5 : “Internal variability in simulated and observed tropical tropospheric temperature trends”, figures 2c and 4c
So the hot spot (by which I mean greater warming in the tropical upper troposphere vs. near the tropical surface) exists; it isn’t missing.
There is one way to tell if mid to high troposphere OATs are changing – spend your entire working life there! I recently finished a nearly 40 year career as an international airline pilot for United Airlines. Consider that pilots are very interested in OATs as they affect our cruise altitude step climb schedules, our overall fuel burnout, the locations of clear air turbulence associated with the tropopause, and the altitude of the dreaded “Coffin Corner”. Our flight plans have the altitude of the tropopause posted for every navigational waypoint. There can be over 50 such waypoints on an over-the-pole flight to Asia. I can assure you that over all my years, those altitudes have never changed. The overall worldwide year round average altitude of the “trope” as we called it was 36,089 feet in 1965 and the same when I retired in 2003.
AGW? Nice try, liberals!
Dear Walt,
The HadAT2 Radiosonde data in the first image show hardly any change at flight height (-0,1C to +0,2C), so your OAT observation is in line with the data.
Average Tropopause height is a difficult notion, since it varies from almost on the surface sometimes on the poles, to up to 20 km high above tropical thunderstorms in the tropics. A linear worldwide average doesn’t have much meaning.
But as I explain in chapter 9, the standard greenhouse theory would require a clearly noticeable rise in tropopause. If we can establish that there is no such thing, this is another proof that the standard theory is flawed.
The theory of this site is based on more evaporation as the way climate deals with more heat trapped on the surface, as a thermostat (based on the Tropical Thunderstorm Thermostat theory of Willis Eschenbach).
This does not require a higher tropopause, but it does require more precipitation, and a higher OLR in the subtropics (see chapter 10).
Both have been observed.